
 By Julie Alig, Ph.D., JLA Analytics, LLC
Now that we’re well into the new year, many of us are taking on new habits, including tracking things that are important to us. Our water intake, the number of steps we walk, or the number of minutes we spend on our smartphones each day. The same approach works in our organizations: we track the things we want to improve upon.
I’ll admit up front that tracking data week over week, month over month can feel like a chore. That’s why I’d like to share with you a way I’ve found to energize how you track one of the metrics that’s critically important to the health of every business: your retention and turnover rates.
Why focus on retention and turnover metrics?
The Great Resignation has been an unexpected result of the COVID pandemic. Employees are quitting now for a variety of reasons, including caregiver responsibilities, higher pay elsewhere, lack of career development opportunities, to simple COVID burnout. With this many reasons for employee departures, there’s not one or even a handful of tactics that can address them. Instead, companies can defend against this trend by returning to the basics: treating employees well in terms of fair and competitive compensation; providing the benefits and flexibility they want; and nurturing a culture of support and opportunity.
I’m reminded of the adage, “People vote with their feet.” If your organization is successfully meeting its objectives, then employees are more likely to remain part of your team. But when there’s a disconnect between objectives and output, you’ll start to see employees’ feet moving in the direction of the door.
A survey of over 700 HR leaders conducted by Forrester Research in August 2021 found that Recruiting and Retention was rated as “Very Important” by 62% of respondents, the highest proportion out of a list of 10 priorities. In second place was Employee Experience and Engagement, which 55% of respondents rated as “Very Important.” Perhaps at no other time has retention been more important. How can a businesses make it a habit to focus on this?
Tracking metrics over time.
The standard way of tracking your employee comings and goings is by calculating retention or turnover rates (or both). This lets you keep an eye on how many employees you have at any given time, and then how that’s changing across months or years. You might even take these numbers and convert them into a graph so that you can see the trendlines. Are your retention rates increasing, or decreasing? How do they look compared to the same time last year? Answering these questions will give you an understanding of what’s happening at your organization.
Seeing the overall picture is an important first step. But to get to the full story about what’s happening with your retention or turnover rates, you’ll want to dig a little deeper. We do this by breaking down your numbers into groups and subgroups. This is where the magic happens!
Start by asking what types of groups you have.
- Think of your employees themselves and who they are. You could separate them into categories by age or generation, by education level, by level of seniority, etc.
- Consider how your employees contribute to your organization. Look at warehouse employees compared to back-office employees, for example. If you have several locations, you could look at employees at Location A compared to employees at Location B and Location C. Or you may want to look at the Sales department compared to Finance.
- If your organization has a Strategic Plan or Goals for the year, there may be priority initiatives that call out specific groups to track. If you have a Diversity statement, and goals to reach for the year, you may want to look at retention/turnover rates by race/ethnic categories. Some organizations offer internships to college students, with the intention of building a pipeline of skilled employees. How often do these interns end up as full-time employees who remain with the organization for longer than 6 months?
What should you be on the lookout for?
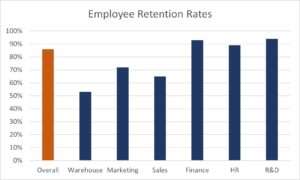
I’m often asked by clients and students, What exactly should I be looking for when I’m doing this? When I do this sort of analysis for clients, I start by comparing their overall metrics to the ones for their subgroups.
- If your organization’s overall retention rate is 86%, but for the warehouse it’s 53%, that would catch my eye. What’s the reason for that large gap?

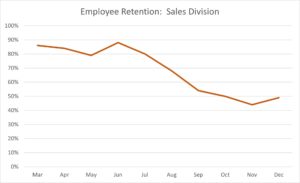
- Sometimes I see an organization’s retention rate for particular division holding steady and then over a period of three months it takes a nosedive. What happened?

When is it enough?
It’s easy to keep digging and digging with this sort of breakdown — where do you stop? My suggestion is, tackle this step by step for your organization. Once you’ve generated your basic retention/turnover metrics for the entire organization, sit back and look. What’s the data telling you? From there, break it down by one of the groups mentioned above and then again, sit back and look. What insights are emerging?
At this point, you might have enough information to know where you need to take action, and that’s just fine. This is the sort of analysis you can keep coming back to and refining. In fact, it’s the kind of analysis that yields better insights the more often you come back to it. In other words: make it a habit.
Bringing clarity to chaos: about the Author.
Dr. Alig brings clarity to chaos for business owners by using their data and her analytics. Through her company, JLA Analytics, she helps them better understand their customers and employees, optimize their product mix, increase their marketing ROI and social media reach, and ultimately boost their bottom line. She earned her doctorate in Political Science at the University of Chicago, and worked in higher ed administration for 20 years doing surveys, analysis and projections. Venturing out on her own, she now brings those same sorts of tools and techniques to her clients, including restaurants, medical devices manufacturers, and HR departments. A native of Cincinnati, Julie lives in Manchester, NH with her husband and two teens. When she’s not crunching numbers, Julie loves playing jazz and blues tunes on her Gibson.